Wednesday, June 24, 2009

Crystal Ball

There are many who think that fundamental analysis is important to use when making a trade, even if it was technical analysis that created the entry point. Last night I got stopped out of a trade that could have been a significant loss had it not been for a stop loss.

The trade was in the US/CHF and this move was something that I have never seen before:


I am a big Kathy Lien fan. She is an interesting read and I have learned a lot from her about fundamental analysis. See what
she wrote about the above chart six days before it happened!

UNUSUAL

Because of the way markets are constituted, it is unusual to see them all going the same direction...very unusual (11:23 e.s.t.) Check out the top of my trade triangle software page. (Clicking on the chart gives you a clearer view):


Trade Update and why you have to use stops

Last night, I covered half my US/CHF short with a $130.00 profit. Then I moved my stop up to b/e (where I originally shorted)...thankfully.

The Swiss National Bank came in and bought the Euro/CHF and US/CHF, thus creating the longest bar you will ever see. By moving up my S/L, I was stopped out with no loss. In the next post I'll discuss what the SNB did, because it was very interesting.

I am still short US/Yen and shorted more when we got some rotation.
In my medium term account, I am short CAD/Yen.


Tuesday, June 23, 2009

Update

As per the Trader Outlook method, we ended up shorting half positions in both the US/Yen and US/Swissy in case they were to rotate before continuing down. Both have rotated and I have shorted the second half of my trade in US/Yen.

I also have re-shorted a full position in the Cad/Yen. The break in the 6 month trendline is now accompanied by a new turndown in the MACD. Keep in mind, Market Club is issuing down triangles in many indexes that travel with the S+P and Dow e.g. the QLD or QQQQ.

Watching these trades

These are all relating to 4 hour closes. We are looking at 1:00 p.m. for the first 4 hour close. From Bob Iaccino of Trader Outlook:

Short US/Yen if we close below 95.51. Even though we have 2 profit targets for this trade, it is already trading significantly through our entry point (95.52), so I may consider doing only a half position. (I made a profit on this trade yesterday.)

Short AUD/US if we close below 78.26. I lost on this yesterday because I jumped in before the close and we ended up not closing below 78.26. Tut, tut.

Short USD/Swissy. We are much lower then original entry point for this (1.07112.) 1.0647 is target, so I am unsure.

Short GBP/USD if we close below 1.6208.

Long EUR/GBP if we close above 0.8573 (area.)

I will be using a couple of other indicators to confirm these trades, especially my trade triangles.

Monday, June 22, 2009

Misc.

Out of the CAD/Yen trade with an excellent profit...

I probably could have gotten more but I decided to cover the whole position...because there will be other trades. (Click on image to see.)

----------------
I am also officially in two of the Trader Outlook trades...short both the USD/YEN and AUD/USD. Details to follow.

Also watching the US/YEN

We are watching the USD/Yen for a short here. Looking for a close on the 4 hour chart below 95.50. On this particular bar, the low hit 95.32 and is again trading above that point now.

This is a Trader Outlook trade by Bob Iaccino. They are good for the conservative Forex investor, if there is such a thing. Only one out of their last 6 trades have been activated as the pairs are trading near, but not at their specific entry points.


Reblog this post [with Zemanta]

New Trade

This one I did without Trader Outlook...the Canadian Dollar/Yen...in my intermediate account.

We have a couple things going on here. First we have a pretty significant break of a trendline (torquoise) going back to early January. When you look at the chart you will also see that the 55SMA was broken and the 100 and 200 days are next (white and red respectively.

Clicking on the chart gives you a clearer view:


Trading Plan: Shorted 1 Lot CAD/YEN @ 83.07
Cover half @ 81.75 area
Second target @ 78.62 area

Confirmations: Commodities (including Gold) showing topping.
Equities doing the same.


Reblog this post [with Zemanta]

Trade update

My main Forex account is up about 72% since the beginning of January. I sold my Gold in the 960's and repurchased it at around 951 and it is in the new account at the bottom.

My intermediate Forex account,
which is up 16% since January (Zip file.)

My options and equity account, which are titled in my children's names, so I can only recreate the trades.

Here are the account particulars:
--My
Sprint trade (which I closed at around 13% profit)
--My
Zion Bank trade. (26% profit)
--The Gold puts purchased to protect my long term gold position have expired with a $3000 loss.
--The
Puts I bought (and sold) to protect my gold, the first time around. ($11,000 profit)
---My S+P puts which expired worthless with a loss of $3,100. I am considering buying them again. Obviously, I should have gone out to July or August.

AND Trader Outlook. Looked pretty ugly at first because of a trading mistake, but it has started to turn around as you can see.


Reblog this post [with Zemanta]

Sunday, June 21, 2009

4 hour chart trades

The great thing about 4 hour charts is that when a bar from that chart closes above or below any length trendline...it shows more conviction in that direction. At night I will only use this method for a scalp trade. Here is the Eur/USD, which we discussed in the last post as looking weak longer term. (Clicking on the chart gives you a clearer view):

I did a small trade for a $52 profit.
Reblog this post [with Zemanta]

How Trade Triangles work

Occasionally a reader will ask me why I use Trade Triangles as one of the indicators to go to before a trade is placed. To some, triangles seem too basic...but it's the combination of "Weekly" and "Daily" triangles that has helped my accounts do so well. If you watch any of Adam's videos, you'll see why they work so well. They are meant to be used in conjunction with other indicators.

Anyway, on the equity Barrick Gold and on the Gold spot, Market Club recently issued weekly down triangles for both. The key to good trading is to find confirmations (or disparities) to trade indicators and, ironically, the first one that I have found is within Market Club itself...a WEEKLY down triangle on the Euro/Greenback chart (Dollar positive.) Since the Dollar and Gold usually work inversely, this is a confirmation.


Lastly, DAILY trade triangles can occur every few days (at times,) but weeklies are a different story. Check out any equity or security you can think of, and you will find that there was a significant move for it in the direction of the weekly arrow that was originally issued...it's amazing how right they are. You can try it free for 30 days like I did.

Stay unbiased...

I am a bear here...I think the markets are way overbought. BUT as a trader, I have to keep reminding myself that it doesn't matter what I think the markets are going to do, but what the indicators tell you they will do.

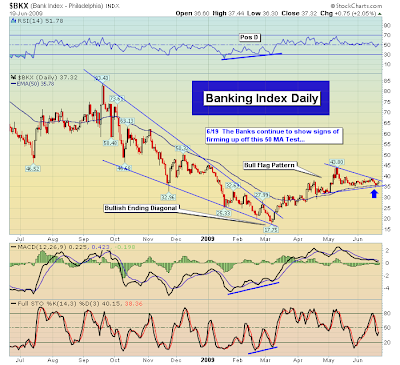
Jack Steiman of Swingtradeonline, who I think is an excellent chartist, visually makes some good cases for a weaker Dollar and a strong banking index (SPX) from here. In this case he uses Flag Patterns, which are among my favorite technical indicators. Obviously, if both prove out to be true, equities will be a lot higher then they are now.

(Clicking on the charts give you clearer views):


AND

This is the reason that I always try to hold Gold and not worry about how far down it is from where I bought it. I made significant profits on it last time and now own it again. If the Dollar does resume down from here, Gold is likely to get close to $1000 oz again.