Anyway, as I always say, it's important to study the equity markets to get a sense of what commodities and currencies will do. So, being the technician that I am, I posted this excellent (and understandable) description of the S+P levels to watch (pdf)...good stuff from CitiFX in there too.
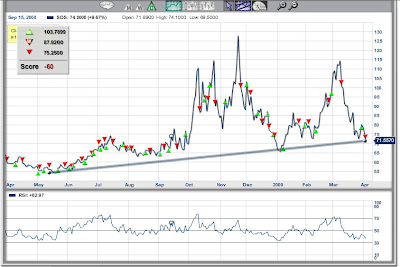
Below is a good chart of the SDS ETF. I like it because it is an opposite trading instrument i.e. when equities go down, the SDS rises. It's also great for taking advantage of shorting with margin, without actually taking the equivalent risk associated with shorting with margin, in that it's weighted three times the actual volatility of the NYSE or S+P internals.
Anyway, if this breaks, the markets could continue up...looks like significantly. I just don't see it yet...I still think this is a bear market rally and the more people I see on CNBC rattling on about how we have put in a bottom...the more terrified I get.


No comments:
Post a Comment